Translation QA Dashboard with Power BI
📊 Translation QA Dashboard with Power BI
📝 Overview
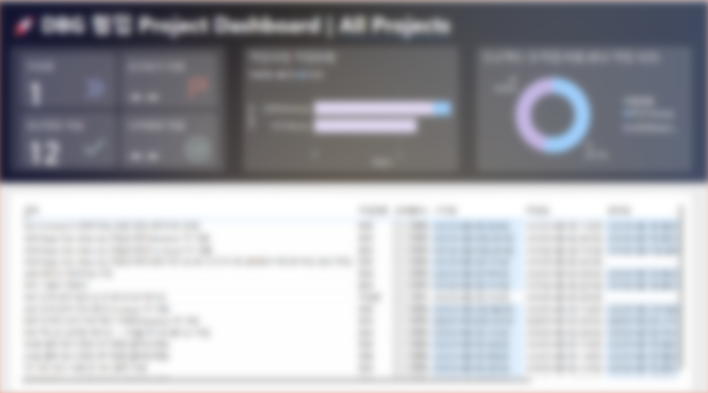
While working as a Assistant Project Manager at PTKOREA, I developed a Power BI dashboard to automate and visualize the QA process for multilingual ad copy translations across global markets. This tool improved internal visibility, streamlined collaboration with translators, and reduced communication overhead for progress tracking.
✨ Key Features
- 🔄 Real-time Progress Tracking: Automatically updates translation review status by market, language, and campaign.
- 📁 Data Integration: Connected to SharePoint and Excel sheets to pull task data with Power Query.
- ✅ QA Completion Metrics: Visual indicators for completed vs. pending reviews, categorized by priority.
- 📆 Timeline View: Gantt-style charts to show deadlines and review durations.
- 🚩 Issue Tagging: Highlighted translations with formatting or compliance issues for easy follow-up.
🛠️ Tools & Technologies
- 🧩 Power BI Desktop: Report and dashboard development
- 🧮 DAX & Power Query: Data modeling, transformations, and metrics calculation
- 📂 Excel/SharePoint Integration: Seamless data sync via cloud-hosted spreadsheets
- 🎨 Custom Visuals: Used conditional formatting and slicers for interactive filtering
🚀 Outcome
- 📉 Reduced manual reporting effort by 80% (from weekly Excel reports to live dashboards)
- 📢 Improved communication across global teams by centralizing all review progress in one visual space
- 🔍 Enabled managers to quickly identify bottlenecks and overdue tasks, leading to faster resolution